Bullish and bearish reversal candlestick patterns can be recognized by the direction of the expected trend reversal; they usually indicate an earlier trend (either upward or downward) that may pause or reverse. A lot of traders apply these patterns to predict when the market will shift and modify their trading tactics accordingly.
The most popular reversal candlestick patterns are explained below.
Bullish reversal patterns
When a downtrend ends, bullish reversal patterns rise to indicate an upward price reversal.
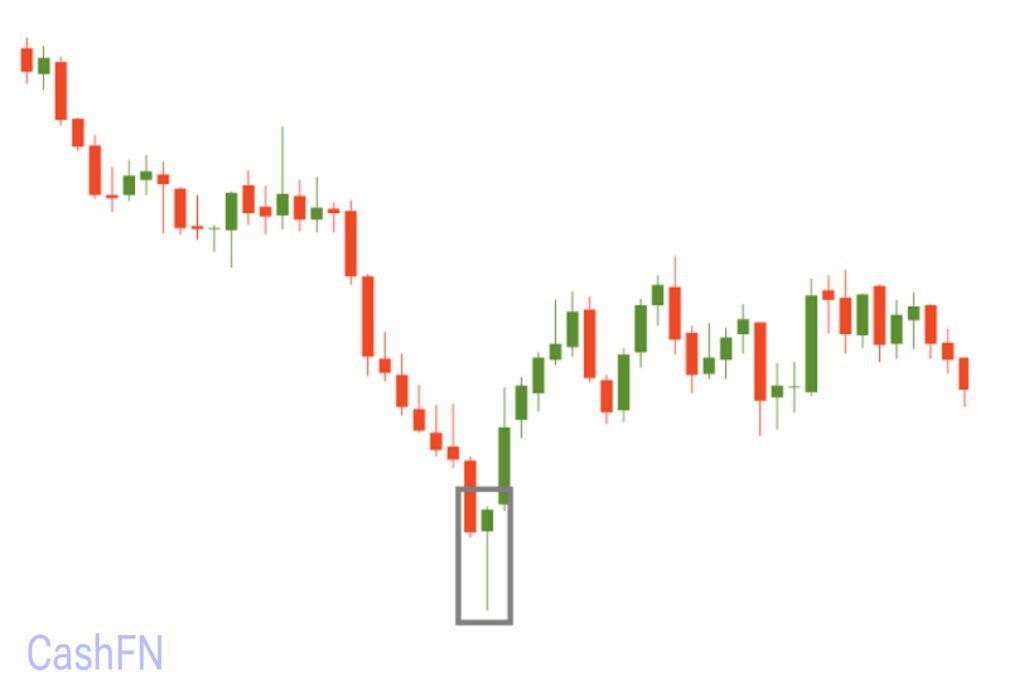
1. Hammer
Popular bullish reversal patterns like the Hammer candlestick pattern indicate that market sentiment can change from bearish to bullish. Usually occurring near the end of a downward trend, it indicates that buyers are taking action to push up prices. For a trading method to be formed, the candle that appears next to the hammer must confirm the trend reversal. Before the hammer, it must close above the final candle that formed.
Stop Loss: To control risk, place below the Hammer’s low.
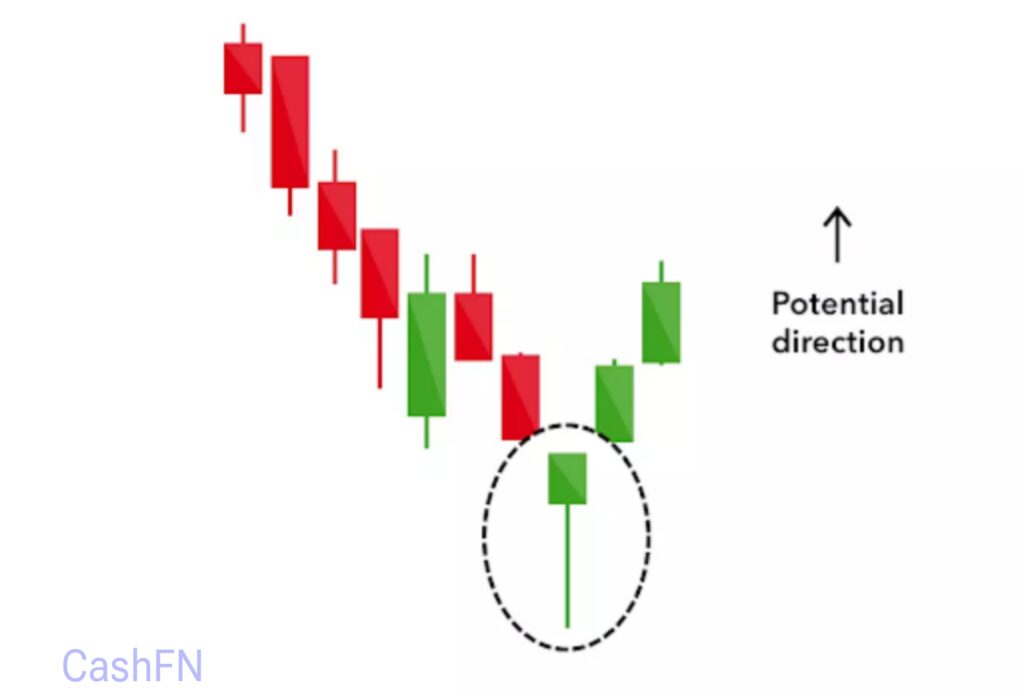
As well, if a candlestick that closes above the opening price of the candlestick on the left follows a hammer, the buy signal will be more trustworthy. This is how the actual chart appears to a hammer:
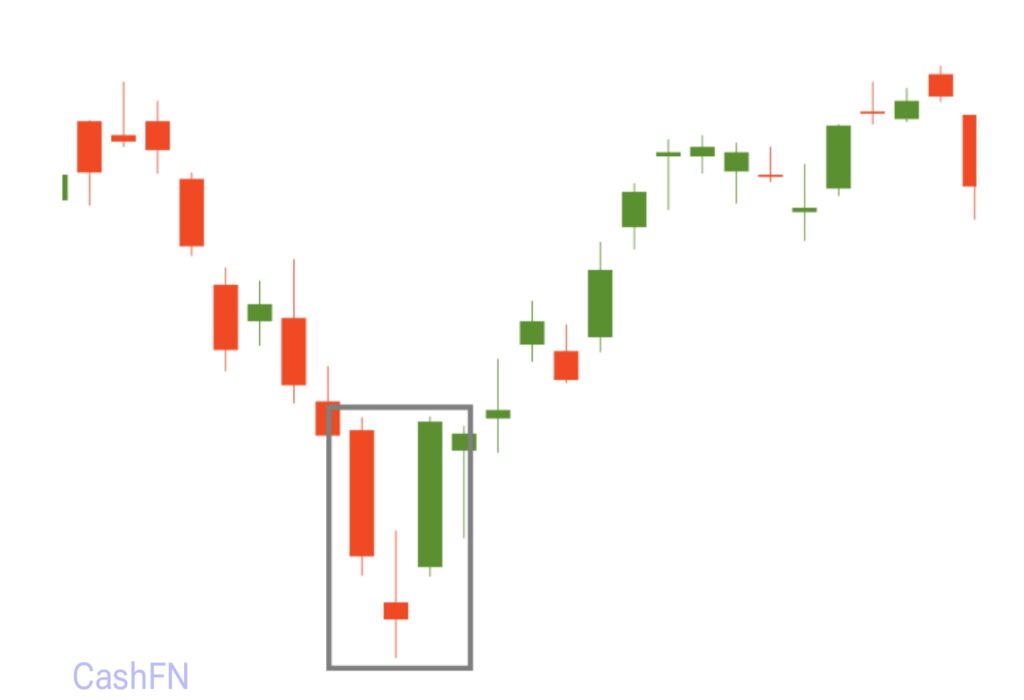
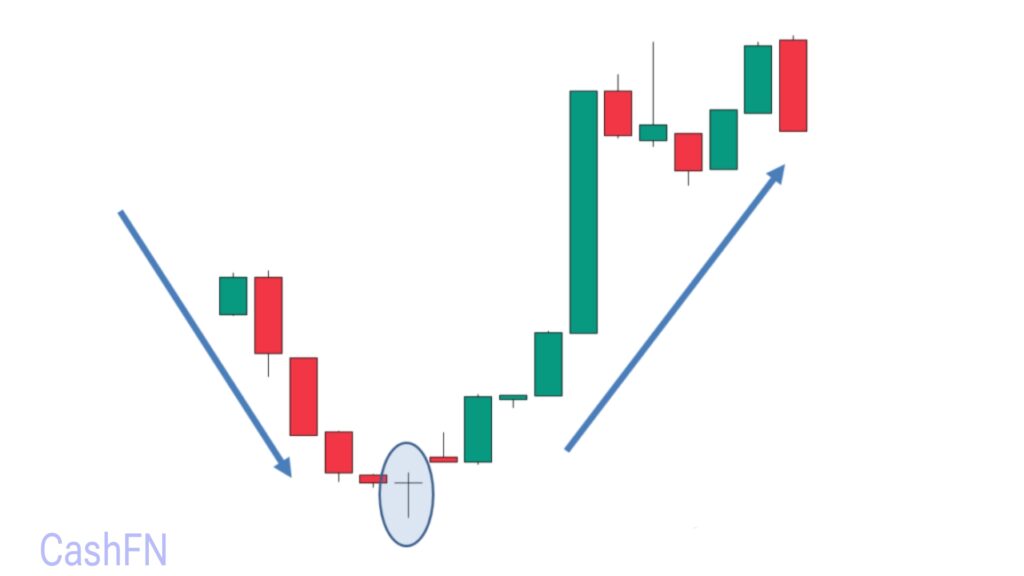
2. Morning Star
An effective technical analysis tool for indicating a possible trend reversal from bearish to bullish is the Morning Reversal Candlestick Pattern. A strong bullish candle, a little uncertain candle (doji or spinning top), and a long bearish candle are usually its three constituents. This pattern is used by traders to find purchasing opportunities, particularly in areas of support. For maximum returns, trading methods and market timing can be improved by identifying this pattern.
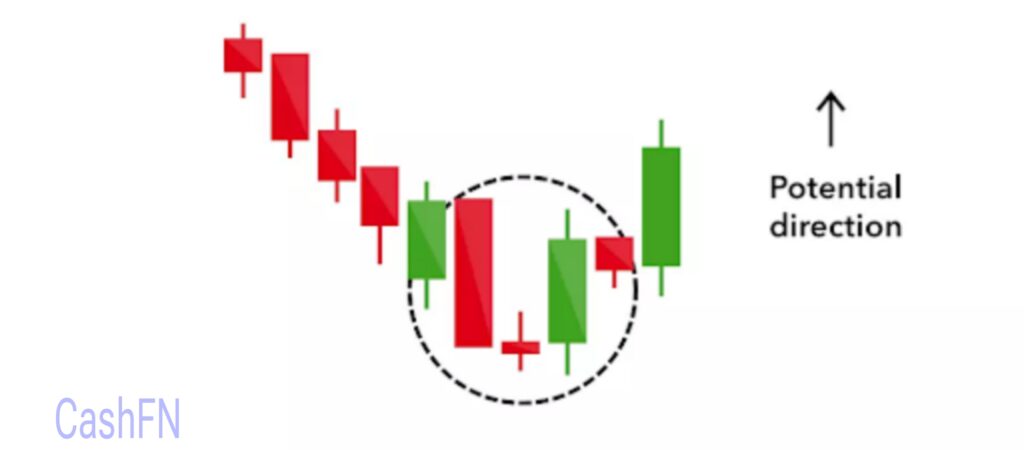
Although gaps are not necessary for this pattern, their presence will strengthen the reversal signal. This is how a morning star candle appears on the real chart.
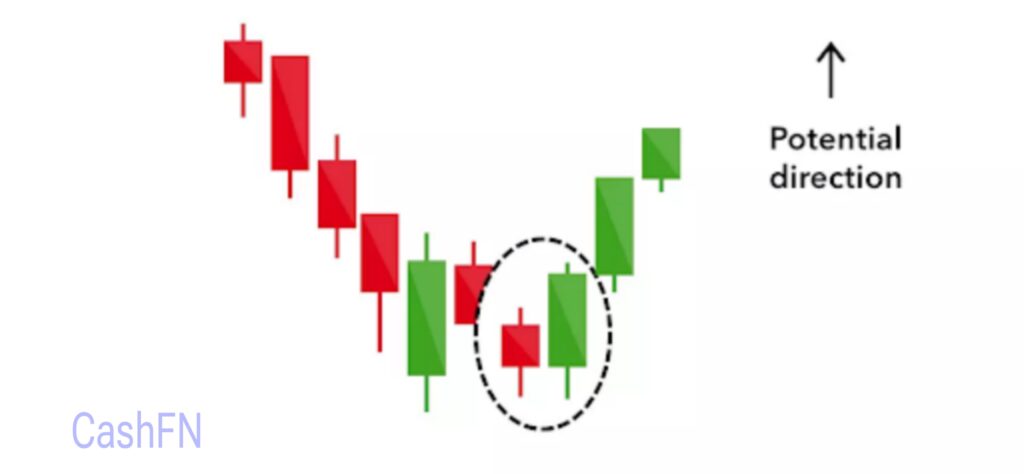
3. Bullish harami
In Japanese, the word ‘harami’ translates to pregnant. It is a two-candle formation where the second candle is a small-bodied candle that opens and closes within the body of the first candle, representing a pregnant form. In the case of Harami Cross, the second candle is a Doji star.A Harami is a reversal pattern, but it isn’t as strong as the hammer and needs confirmation from other technical trading tools.
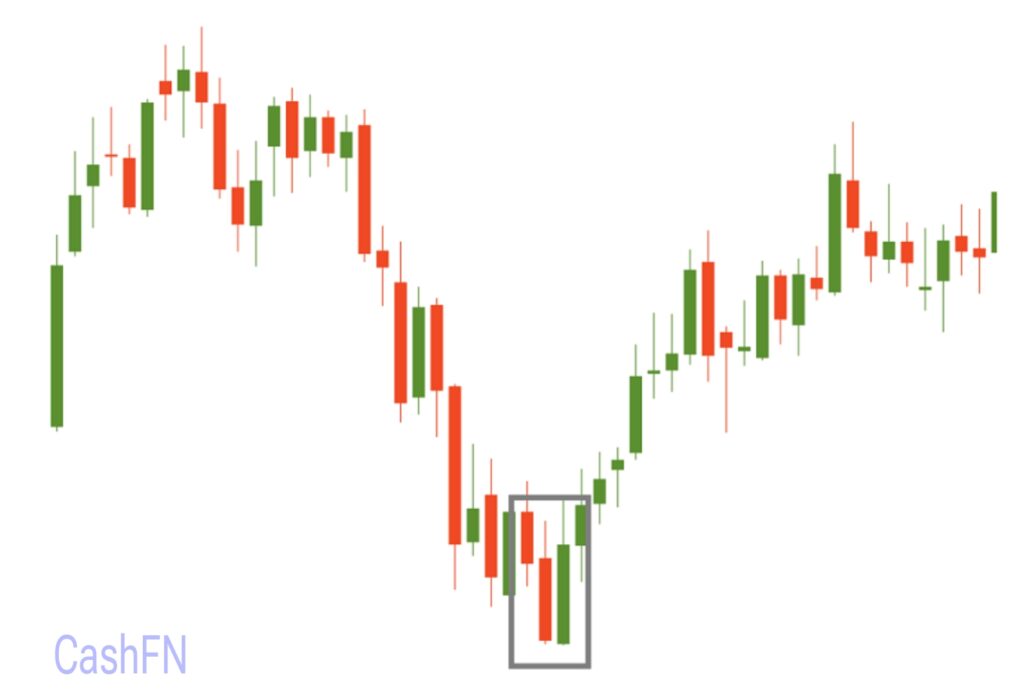
This pattern is a common technique for traders looking for buying chances close to support levels since it suggests less selling pressure and a potential change in market mood. On the actual chart, a bullish harami candle looks like this.
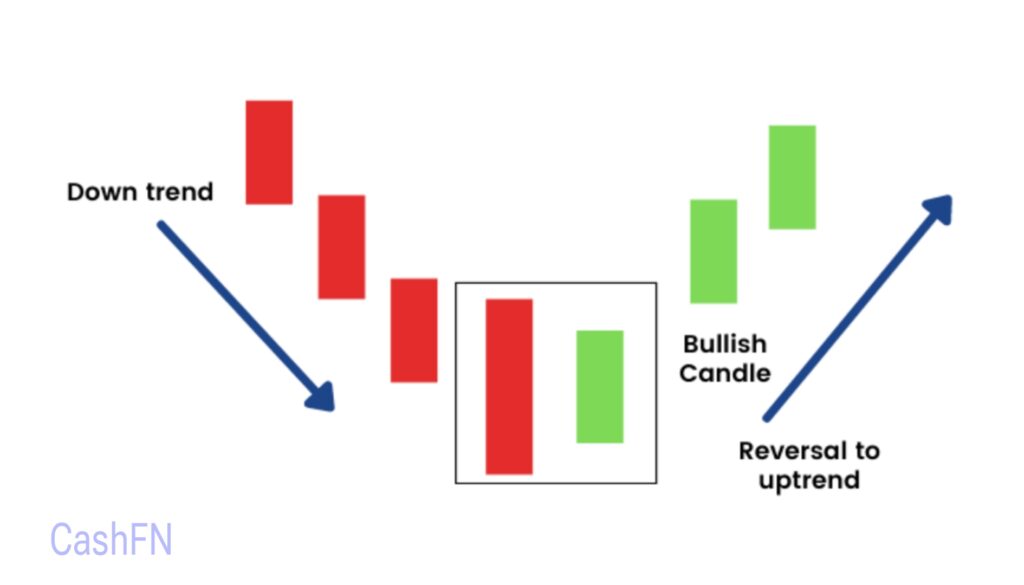
4. Bullish Engulfing
A two-candlestick reversal pattern known as the bullish engulfing pattern indicates a possible change downward to an upward. It consists of a smaller bearish candle in the first place and a larger bullish candle that totally engulfs the first candle’s body in the second. This pattern is most accurate when it appears close to support levels and signifies strong buying pressure.
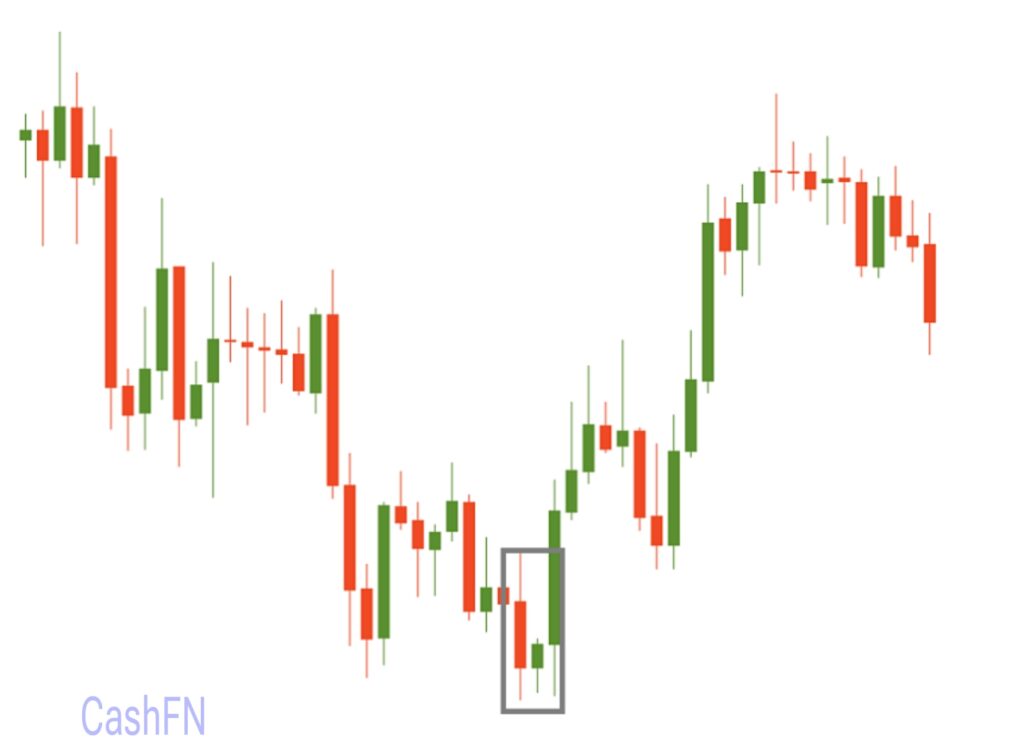
The next candle closing above the bullish engulfing pattern is frequently used by traders to confirm the reversal. On the real chart, a bullish engulfing candle looks like this.
5. Dragonfly Doji
In technical analysis, the Dragonfly Doji is an important candlestick pattern that frequently indicates a possible bullish reversal. It forms a “T” shape with a lengthy lower shadow, opening, rising, and closing at almost the same price.
Bearish reversal patterns
When an uptrend comes to an end, bearish reversal patterns indicate that the price is likely to go down.
6. Shooting star
An important technical analysis signal that frequently points to a possible market trend reversal is the shooting star candlestick. With a long upper wick that indicates significant selling pressure and a little true body close to the candle’s bottom, this bearish pattern emerges at the top of an uptrend.
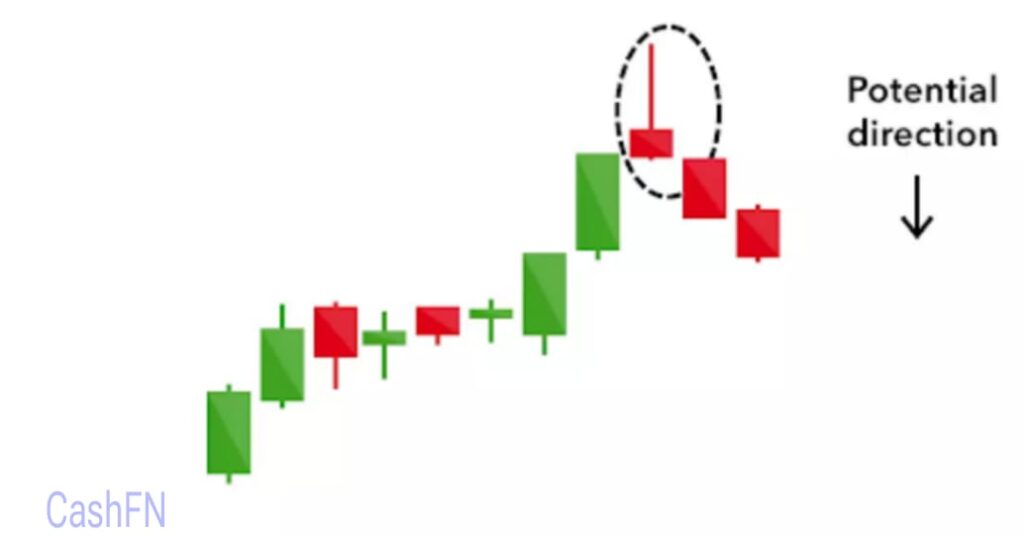
The extended upper shadow suggests that the market attempted to find supply and resistance, but bears rejected the upside. Although the candle can be any color, a bearish candle indicates a stronger signal.
7. Bearish engulfing
One well-known candlestick pattern that suggests a possible market decline is the bearish engulfing pattern. Strong selling momentum appears during an uptrend when a large bearish candle totally engulfs the prior smaller positive candle.
This pattern suggests that bears have gained ground, which might cause the upward trend to reverse.
The strength of the sell signal increases with the size difference between the two candlesticks. A bearish engulfing looks at a real chart like given below:
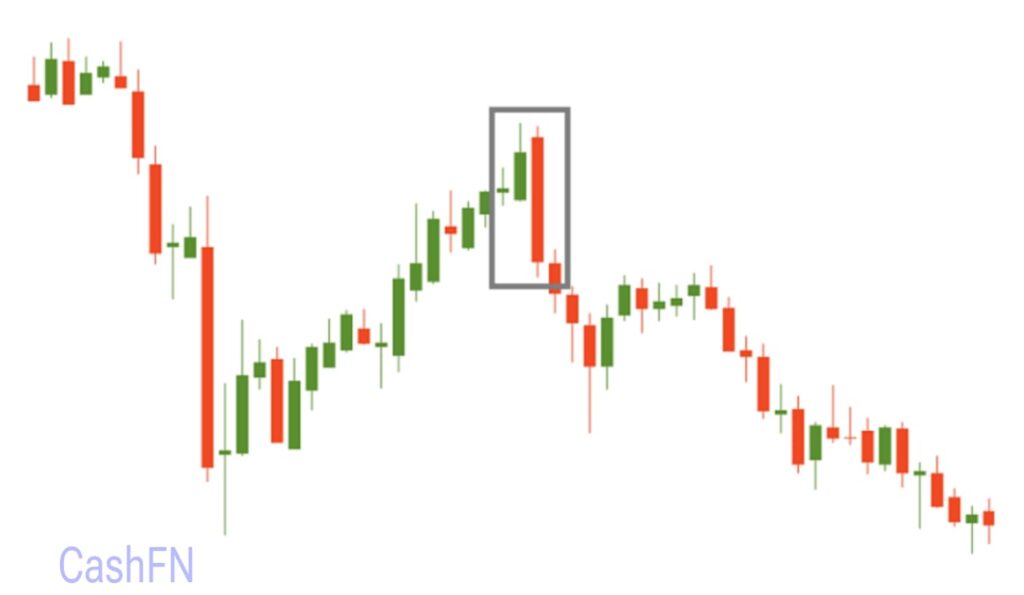
8. Evening star
A pattern of three candles. There is a bullish gap up following a lengthy bullish candlestick. It does not matter what color the second candlestick is; it is little. After filling the previous bullish gap, the third bearish candle opens with a gap down. More often than not, this candle is longer than the first.
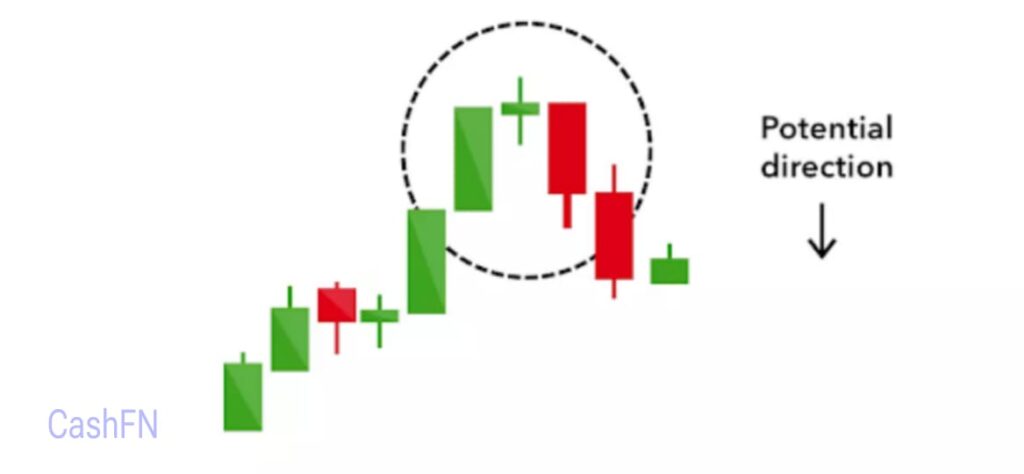
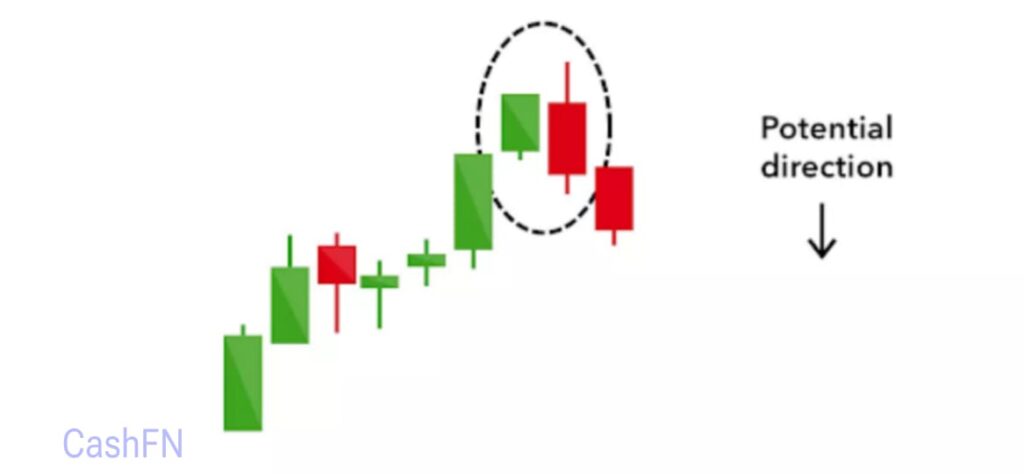
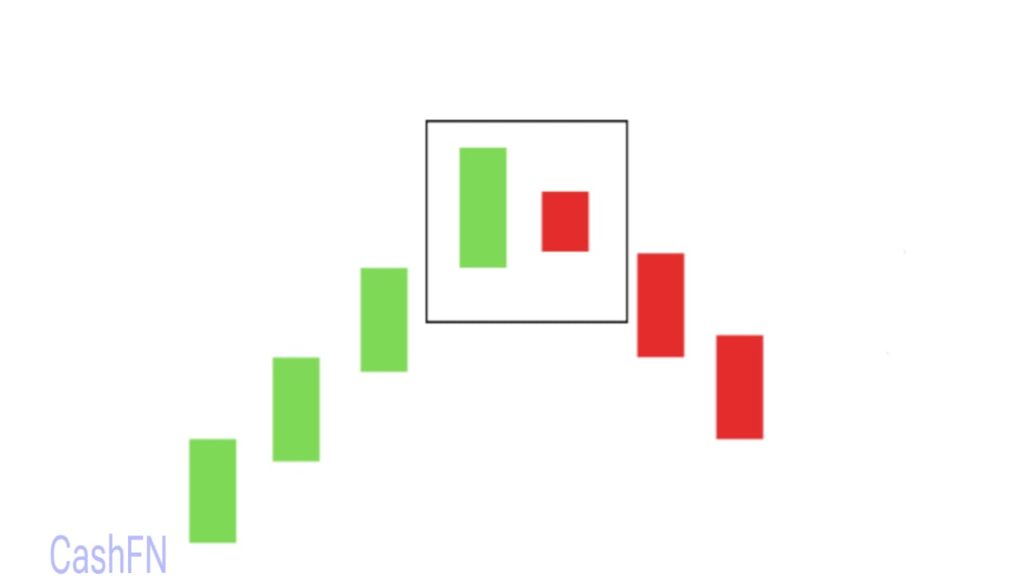
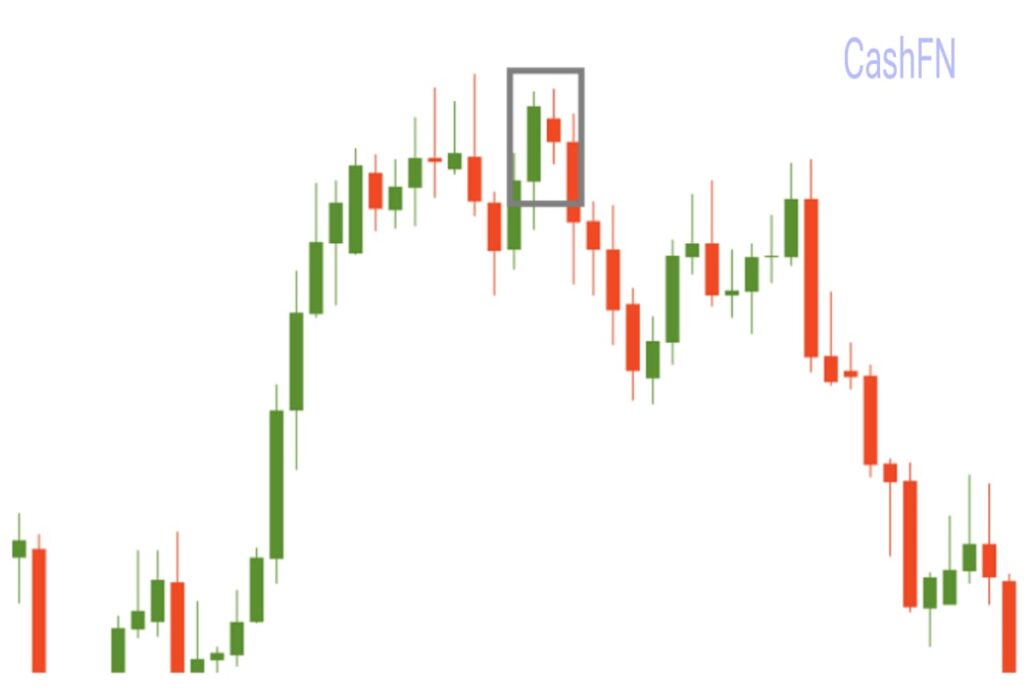
9. Bearish harami
A possible trend reversal in an upward trend is indicated by the Bearish Harami, a two-candle pattern. It is made up of a big bullish candle and a tiny bearish candle that completely fits inside the first one’s body. This suggests that bullish momentum is ebbing and that mood may turn bearish.
Keep in mind that harami patterns must always be verified; a large, bearish candlestick should follow.
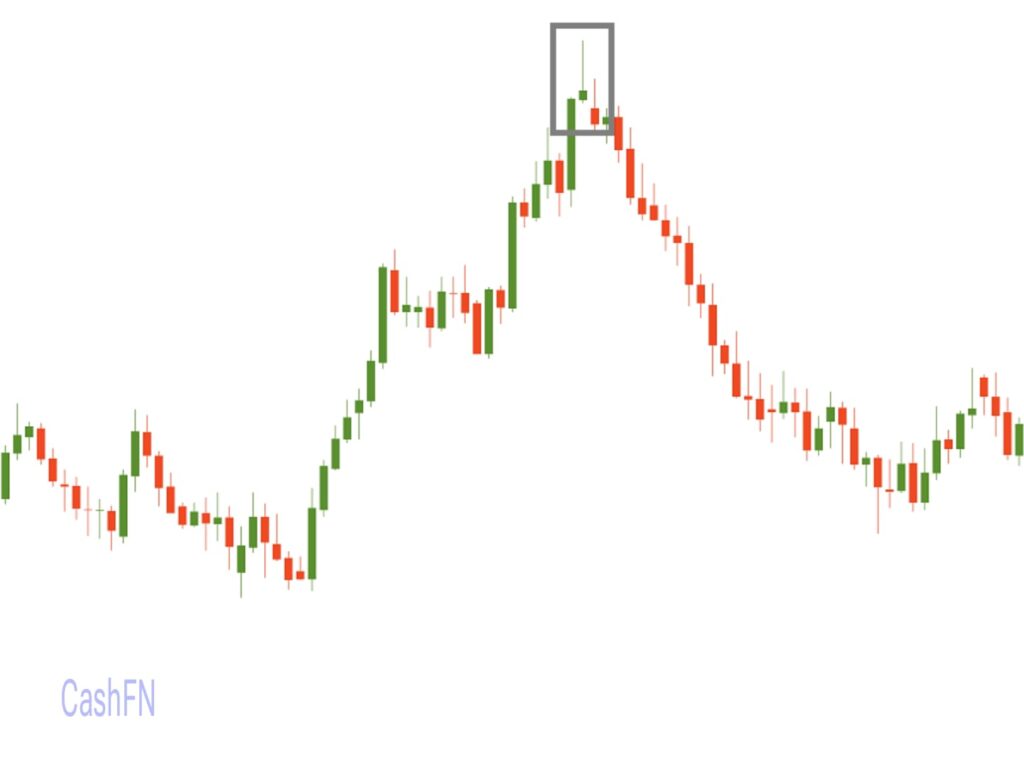
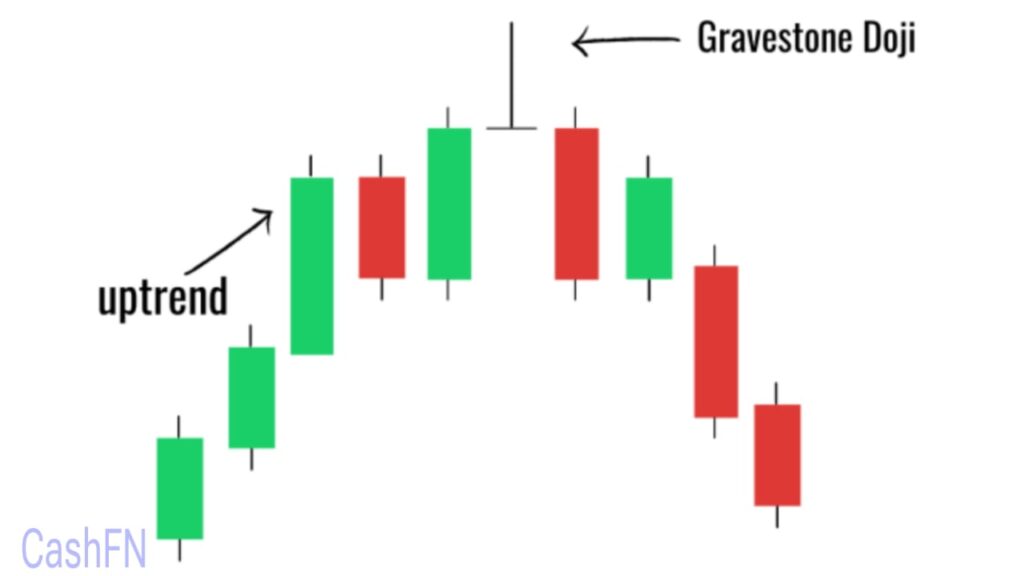
10. Gravestone Doji
A notable candlestick pattern frequently linked to bearish reversals is the gravestone doji. It arises when there is a long upper wick created by the high and the open, low, and close prices are almost equal. After an initial positive surge, this form indicates heavy selling pressure, which could indicate a market downturn.
When an uptrend peaks, the gravestone doji alerts traders of declining bullish momentum.
The Piercing Line, Tweezer Bottom, Dark Cloud Cover, Inverted Hammer, and Hanging Man are a few other significant reversal candlesticks.
For more details you can watch this video
The Evolution of Bitcoin: From Digital Experiment to Financial Powerhouse